6.2. Purpose and composition of the SADT methodology (IDEF0)
SADT methodology (Structured Analysis and Design Technique - the methodology of structural analysis and design) is a set of methods, rules and procedures designed to build a functional model of the system.
The development of this methodology was initiated by Douglas Ross (USA) in the mid-1960s. 20th century Since then, system analysts at SofTech, Inc. improved SADT and used it to solve a wide range of problems. Telephone network software, diagnostics, long-term and strategic planning, computer-aided manufacturing and design, computer system configuration, personnel training, finance and logistics management are some of the areas where SADT is effectively applied. The wide range of areas indicates the versatility and power of the SADT methodology. The U.S. Department of Defense's Integrated Computer Aided Manufacturing (ICAM) program recognized the usefulness of SADT. This led to the publication of a part of it in 1981 called IDEF0 (Icam DEFinition), as the federal standard for software development. Under this name, SADT has been used by thousands of professionals in military and industrial organizations. The last revision of the IDEF0 standard was released in December 1993. US National Institute of Standards and Technology (NIST).
This methodology, in describing the functional aspect of an information system, competes with data-flow-oriented (DFD) methods. In contrast, IDEF0 allows:
Describe any systems, not just informational ones (DFD is intended to describe software);
Create a description of the system and its external environment before defining the final requirements for it. In other words, with the help of this methodology, it is possible to gradually build and analyze the system even when it is still difficult to imagine its implementation.
Thus, IDEF0 can be applied in the early stages of building a wide range of systems. At the same time, it can be used to analyze the functions of existing systems and develop solutions for their improvement.
The IDEF0 methodology is based on a graphical process description language. A model in IDEF0 notation is a collection of hierarchically ordered and interconnected diagrams. Each diagram is a unit of system description and is located on a separate sheet.
Model (AS-IS, TO-BE or SHOULD-BE) may contain 4 chart types [ , ]:
context diagram;
Decomposition diagrams;
Node tree diagrams;
Diagrams for exposition only (FEO).
Context diagram (top-level diagram), being the top of the tree structure of diagrams, shows the purpose of the system (main function) and its interaction with the external environment. There can only be one context diagram per model. After the description of the main function, functional decomposition is performed, i.e., the functions that make up the main one are determined.
Further, the functions are divided into subfunctions and so on until the required level of detail of the system under study is reached. Diagrams that describe each such fragment of the system are called decomposition diagrams . After each decomposition session, examination sessions are held - subject matter experts indicate the correspondence of real processes to the created diagrams. The found inconsistencies are eliminated, after which they proceed to further detailing of the processes.
Node tree diagram shows the hierarchical dependence of functions (works), but not the relationship between them. There may be several of them, since the tree can be built to an arbitrary depth and from an arbitrary node.
Diagrams for exposure are built to illustrate individual fragments of the model in order to display an alternative point of view on the processes occurring in the system (for example, from the point of view of the organization's management).
6.3. Elements of IDEF0 Graphic Notation
The IDEF0 methodology has found wide acceptance and application, primarily due to the simple graphical notation used to build the model. Diagrams are the main components of the model. They display the functions of the system in the form of rectangles, as well as the links between them and the external environment through arrows. The use of just two graphical primitives (rectangle and arrow) allows you to quickly explain the rules and principles of building IDEF0 diagrams to people unfamiliar with this methodology. This advantage allows you to connect and activate the customer's activities to describe business processes using a formal and visual graphic language.
The following illustration shows the basic elements of the IDEF0 graphical notation.
Rice. 6.1. Elements of IDEF0 Graphic Notation
The rectangle represents work (process, activity, function or task) , which has a fixed goal and leads to some end result. The name of the work must express the action (for example, "Manufacture of the part", "Calculation of permissible speeds", "Formation of the CDL statement No. 3").
The interaction of works between themselves and the outside world is described in the form of arrows. IDEF0 distinguishes 5 types of arrows :
- entrance (English input) - material or information that is used and transformed by work to obtain a result (output). The input answers the question “What needs to be processed?”. As an input, it can be either a material object (raw material, part, examination ticket), or one that does not have clear physical contours (database query, teacher's question). It is allowed that the work may not have any entry arrow. Entry arrows are always drawn entering the left side of the job;
- control (English control) - managing, regulating and normative data that guides the work. Management answers the question “In accordance with what is the work done?”. Management affects the work, but is not transformed by it, i.e. acts as a limitation. Rules, standards, regulations, prices, oral instructions can be used as management. The control arrows are drawn as entering the top face of the job. If, when constructing a diagram, the question arises of how to correctly draw an arrow on top or on the left, then it is recommended to draw it as an input (arrow on the left);
- exit (eng. output) - material or information that represents the result of the work. The output answers the question "What is the result of the work?". The output can be either a tangible object (a part, a car, payment documents, a statement) or an intangible one (selecting data from a database, answering a question, verbal instruction). Exit arrows are drawn coming from the right side of the work;
- mechanism (English mechanism) - resources that perform work. The mechanism answers the question “Who does the work or through what?”. The mechanism can be the personnel of the enterprise, a student, a machine tool, equipment, a program. The arrows of the mechanism are drawn as entering the lower face of the work;
- call (English call) - the arrow indicates that some part of the work is performed outside the considered block. Exit arrows are drawn from the bottom face of the job.
6.4. Types of links between jobs
After determining the composition of functions and the relationships between them, the question arises of their correct composition (association) into modules (subsystems). This implies that each individual function must solve one, strictly defined task. Otherwise, further decomposition or separation of functions is necessary.
When combining functions into subsystems, it is necessary to strive to ensure that internal connectivity (between functions within a module) is as strong as possible, and external connectivity (between functions included in different modules) is as weak as possible. Based on the semantics of the links of the methodology, we introduce a classification of links between functions (works). This classification is an extension of . The types of links are given in decreasing order of their significance (strength of binding). In the examples given, the thickened lines highlight the functions between which there is a considered type of connection.
1. Hierarchical connection (connection "part" - "whole") takes place between a function and the subfunctions of which it is composed.
Rice. 6.2. Hierarchical relationship
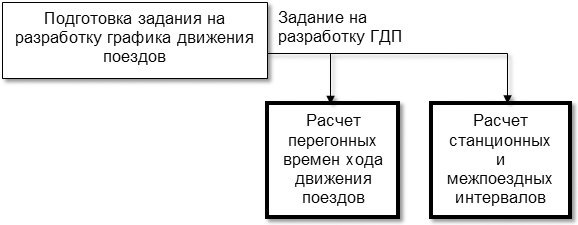
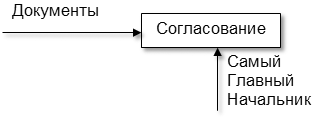
2. Regulatory (controlling, subordinate) communication reflects the dependence of one function on another, when the output of one work is sent to control another. The function from which control comes out should be considered regulating or controlling, and into which it enters - subordinate. Distinguish direct control link , when control is transferred from a higher job to a lower one (Fig. 6.3), and management feedback , when control is transferred from the lower to the higher (Fig. 6.4).
3. Functional (technological) connection occurs when the output of one function is the input to the next function. From the point of view of the flow of material objects, this connection shows the technology (sequence of work) for processing these objects. Distinguish direct connection by input when the output is transferred from the upstream job to the downstream (Figure 6.5), and input feedback when the output is transferred from downstream to upstream (Fig.6.6).
 |
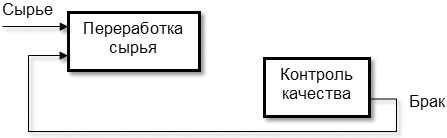 |
| Rice. 6.5. Direct connection on entry | Rice. 6.6. Input Feedback |
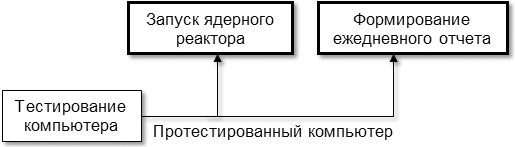
4. Consumer Communication occurs when the output of one function serves as the mechanism for the next function. Thus, one function consumes resources generated by another.
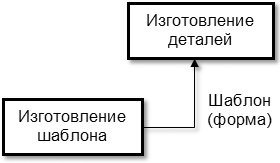
Rice. 6.7. Consumer Communication
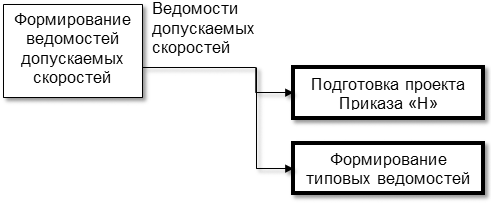
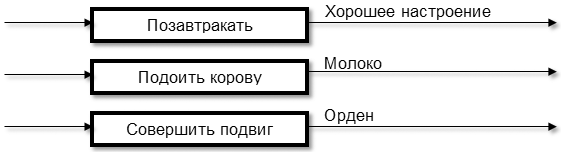
5. Logical connection observed between logically homogeneous functions. Such functions, as a rule, perform the same work, but in different (alternative) ways or using different source data (materials).
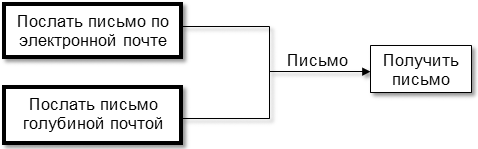
Rice. 6.8. Logical connection
6. Collegiate (methodical) communication occurs between functions whose operation algorithm is determined by the same control. An analogue of such a connection is the joint work of employees of one department (colleagues), reporting to the boss, who gives instructions and orders (control signals). Such a connection also occurs when the algorithms for the operation of these functions are determined by the same methodological support (SNIP, GOST, official regulatory materials, etc.) serving as control.
Rice. 6.9. Methodical connection
7. Resource connection occurs between functions that use the same resources for their work. Resource-dependent functions, as a rule, cannot be executed at the same time.
Rice. 6.10. Resource connection
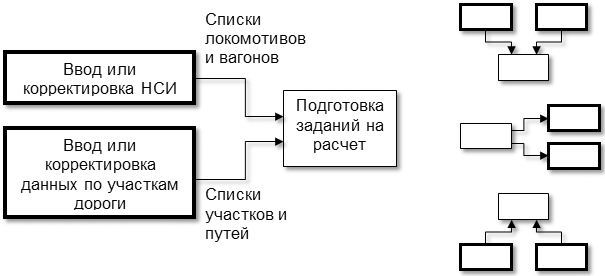
8. Information connection occurs between functions that use the same information as input.
Rice. 6.11. Information connection
9. Temporary connection occurs between functions that must be executed at the same time before or at the same time after another function.
In addition to the cases indicated in the figure, this connection also takes place between other combinations of control, input and mechanism entering the same function.
Rice. 6.12. Temporary connection
10. Random connection occurs when there is little or no specific relationship between functions.
Rice. 6.13. Random connection
Of the above types of links, the strongest is the hierarchical link, which, in fact, determines the association of functions into modules (subsystems). Regulatory, functional and consumer ties are somewhat weaker. Functions with these relationships are usually implemented in a single subsystem. Logical, collegial, resource and information ties are among the weakest. Functions that have them, as a rule, are implemented in different subsystems, with the exception of logically homogeneous functions (functions connected by a logical connection). Temporal connection indicates a weak dependence of functions on each other and requires their implementation in separate modules.
Thus, when combining functions into modules, the first five types of links are the most desirable. The functions linked by the last five links are best implemented in separate modules.
In IDEF0, there are conventions (rules and guidelines) for creating diagrams that are designed to make it easier to read and examine the [ , ] model. Some of these rules are supported automatically by CASE tools, while others must be enforced manually.
1. Before building a model, it is necessary to decide which model(s) of the system will be built. This includes specifying its AS-IS, TO-BE, or SHOULD-BE type, as well as specifying the position from which the model is built. A "point of view" is best thought of as the place (position) of a person or object that one has to stand in order to see the system in action. For example, when building a model of a grocery store, you can choose a salesperson, cashier, accountant, or director among the possible applicants from the point of view of which the system is being considered. Usually, one point of view is chosen, which most fully covers all the nuances of the system operation, and, if necessary, FEO diagrams are built for some decomposition diagrams, displaying an alternative point of view.
2. The context diagram displays one block showing the purpose of the system. It is recommended to display 2-4 arrows for it, entering and exiting from each side.
3. The number of blocks on decomposition diagrams is recommended within 3–6. If there are two blocks on the decomposition diagram, then it, as a rule, does not make sense. If there are a large number of blocks, the diagram becomes oversaturated and difficult to read.
4. Blocks on the decomposition diagram should be placed from left to right and from top to bottom. This arrangement allows you to more clearly reflect the logic and sequence of work. In addition, the routes of the arrows will be less confusing and have a minimum number of intersections.
5. If a function does not have control and entry arrows at the same time, it is not allowed. This means that the launch of this function is not controlled and can occur at any arbitrary point in time or never at all.
Rice. 6.14. Function without control and input
A block with only control can be considered as a call in the program of a function (procedure) without parameters. If the block has an input, then it is equivalent to calling a function with parameters in the program. Thus, a block without control and input is equivalent to a function that is never called for execution in the program.
On fig. 6.7–6.12, displaying fragments of IDEF0 diagrams, there are blocks without input and control. This should not be considered a bug, as one of those arrows is meant to be.
6. Each block must have at least one output.
Rice. 6.15. Function without exit
Works without results are meaningless and should not be modelled. The exception is jobs displayed in the AS-IS model. Their presence indicates the inefficiency and imperfection of technological processes. In the TO-BE model, these works should be absent.
7. When constructing diagrams, the number of intersections, loops and turns of arrows should be minimized.
8. Feedbacks and iterations (cyclic actions) can be depicted using backward arcs. Input feedbacks are drawn by the “lower” loop, control feedback is drawn by the “upper” one (see Fig. 6.4 and 6.6).
9. Each block and each arrow in the diagrams must have a name. It is allowed to use branching (decomposition) or merging (composition) of arrows. This is due to the fact that the same data or objects generated by one job can be used in several other jobs at once. Conversely, the same or similar data and objects generated by different jobs can be used in the same place.
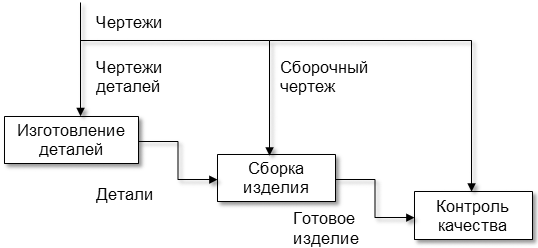
Rice. 6.16. Arrow branching
In this case, it is allowed to assign qualifying names to different branches of the arrow after branching (before merging). If any branch after the branch is not named, then its name is considered to correspond to the arrow name recorded before the branch.
So, in fig. 6.16, the controls included in the blocks "Manufacture of parts" and "Assembly of the product" have clarifying values and are an integral part of the more general control "Drawings". All drawings are used for the operation of the Quality Control block.
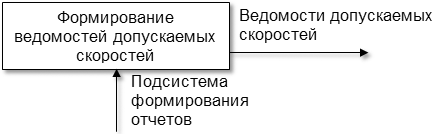
It is not allowed to draw arrows on the diagram when they are not named before and after branching. On fig. 6.17, the arrow included in the "Formation of standard statements" block does not have a name before and after branching, which is an error.
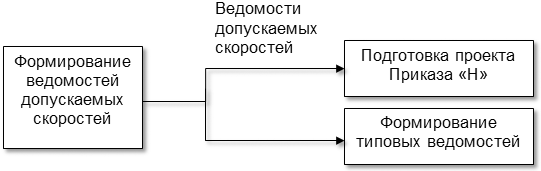
Rice. 6.17. Wrong arrow naming
10. When constructing diagrams for their better readability, the arrow tunneling mechanism can be used. For example, in order not to clutter up the diagrams of the upper levels (parents) with unnecessary details, the beginning of the arc is placed in the tunnel on the decomposition diagrams.
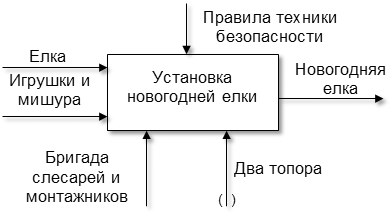
Rice. 6.18. Tunneling arrows
In this example, when building a model for holding a New Year's party, the "two axes" mechanism will not be displayed on the diagrams of the upper levels, when reading which a fair question may arise: "Why do we need two axes at a New Year's party?".
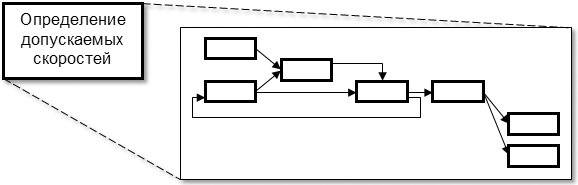
Similarly, you can perform tunneling with the opposite goal of preventing the display of an arrow on lower-level diagrams. In this case, parentheses are placed at the end of the arrow. On the context diagram (see Fig. 6.21), the mechanism “Track service engineer” is tunneled, which is included in the “Determination of allowable speeds” block. This decision was made, since the engineer is directly involved in all the work displayed on the decomposition diagram of this block (see Fig. 6.22). In order not to show this connection and not to clutter up the decomposition diagram, the arrow has been tunnelled.
11. All arrows entering and leaving the block, when constructing a decomposition diagram for it, must be displayed on it. The exception is the tunneled arrows. The names of the arrows transferred to the decomposition diagram must match the names indicated on the top-level diagram.
12. If two arrows run parallel (starting from the same face of one work and ending on the same face of another work), then, if possible, they should be combined and called a single term.
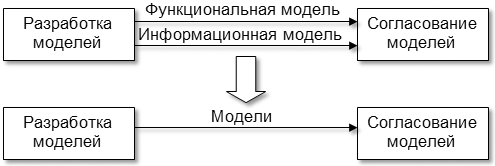
Rice. 6.19. Combining links
13. Each block on the diagrams must have its own number. To indicate the position of any diagram or block in the hierarchy, diagram numbers are used. The block on the top-level diagram is denoted by 0, the blocks on the diagrams of the second level - by numbers from 1 to 9 (1, 2, ..., 9), the blocks at the third level - by two digits, the first of which indicates the number of the detailed block from the parent diagram, and the second block number in order on the current diagram (11, 12, 25, 63), etc. The context diagram has the designation “A - 0”, the decomposition diagram of the first level is “A0”, the decomposition diagrams of the next levels consist of the letter “ A" followed by the number of the block to be decomposed (for example, "A11", "A12", "A25", "A63"). The figure shows a typical diagram tree (node tree diagram) with numbering.
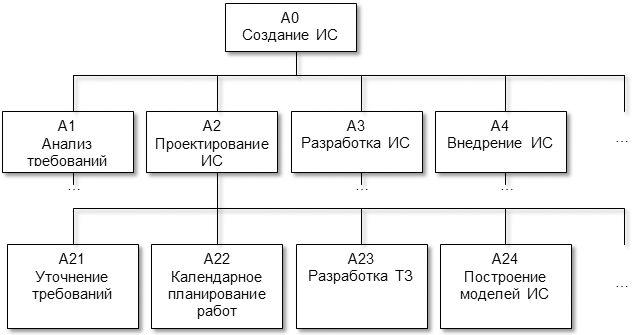
Rice. 6.20. Chart hierarchy
In modern CASE tools, job numbering mechanisms are supported automatically. CASE tools also provide automatic construction of node tree diagrams that contain only hierarchical relationships. The vertex of such a diagram can be any node (block), and it can be built to any depth.
6.6. An example of building an IDEF0 model for a system for determining allowable speeds
Calculation of permissible train speeds is a time-consuming engineering task. When a train passes through any section, the actual speed of the train must not exceed the maximum allowable. This maximum permissible speed is established on the basis of operating experience and specially conducted tests on the dynamics of movement and the impact on the track of the rolling stock. Not exceeding this speed guarantees the safety of train traffic, comfortable driving conditions for passengers, etc. They are determined depending on the type of rolling stock (brand of the locomotive and type of wagons), the parameters of the superstructure of the track (type of rails, ballast, diagram of sleepers) and plan (radius curves, transition curves, outer rail elevation, etc.). As a rule, to establish the allowable speeds, it is necessary to determine at least two (on straight lines) and five (in curves) speeds, from which the final allowable speed is selected, as the smallest of all calculated ones. The calculation of these speeds is regulated by the Order of the Ministry of Railways of Russia No. 41 dated November 12, 2001 "Norms of permissible speeds for the movement of rolling stock on railway tracks with a gauge of 1520 (1524) mm of the Federal Railway Transport".
As noted, the construction of the IDEF0 model begins with the representation of the entire system in the form of the simplest component (context diagram). This diagram displays the purpose (main function) of the system and the necessary input and output data, control and regulatory information, as well as mechanisms.
The context diagram for the task of determining the permissible speeds is shown in Fig. 6.21. The model was built using the BPwin 4.0 product from Computer Associates.
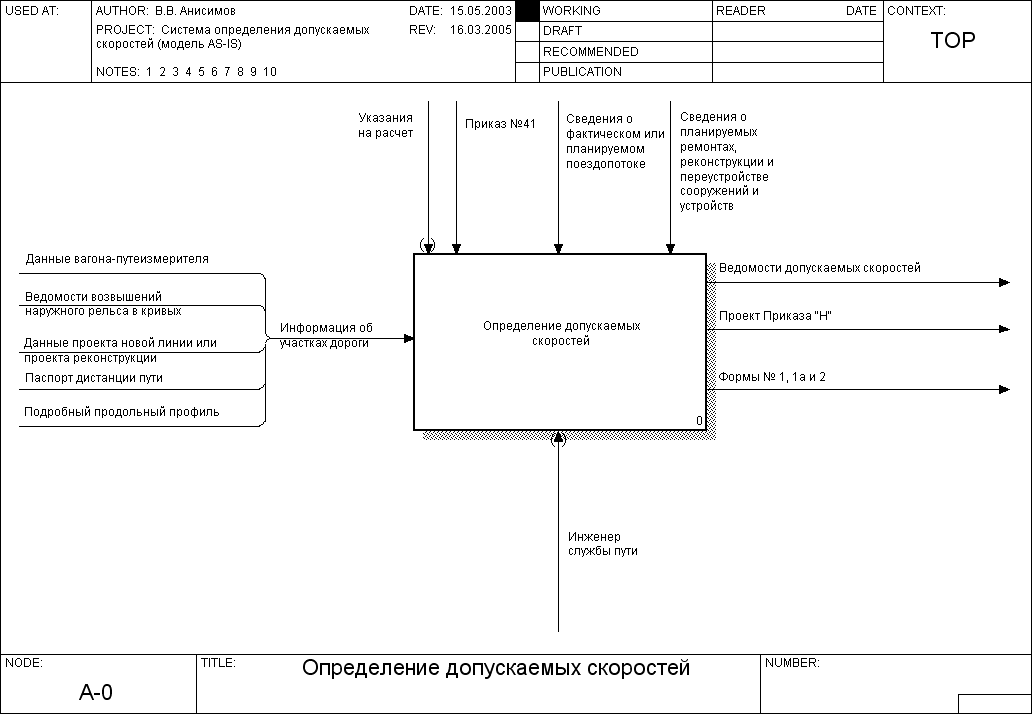
Rice. 6.21. Context diagram of the system for determining permissible speeds (IDEF0 methodology)
As background information, on the basis of which the determination of permissible speeds is carried out, are used:
Data of a new line project or a reconstruction project (contains all the necessary information for the implementation of the project, namely mileage, axes of separate points, line plan, etc.);
Detailed longitudinal profile (contains information similar to that discussed above);
Path distance passport (contains information similar to that discussed above, as well as information about the superstructure of the track (VSP));
Data on the results of surveying the track plan by a track measuring car;
List of elevations of the outer rail in curves (contains information about the track plan).
Some of the initial information can be taken from various sources. In particular, information about the plan (curve parameters) can be taken from a new line project or a reconstruction project, a detailed longitudinal profile, a track distance passport, etc.
control data are:
Indication of the head of the track service of the road or the Department of Track and Structures of Russian Railways for calculation;
Order No. 41, containing regulatory and reference information, the procedure and formulas for determining permissible speeds;
Information about the current or planned train flow (data on the brands of locomotives in circulation and the types of cars used);
Information about the planned repairs of the track, reconstruction and reorganization of structures and devices.
result system operation should be:
Lists of permissible speeds containing all types of calculated speeds and allowing to establish the reason for their limitation;
Statements of the Order of the head of the road on the establishment of permissible speeds on hauls and separate points (Order "N") in accordance with the form adopted on the road. The approved Order "N" officially fixes the permissible train speeds;
Standard forms No. 1, 1a and 2, containing the planned permissible speeds for the development of a train schedule.
The speeds contained in the Order "N" and standard forms may differ from those calculated and shown in the sheets of permissible speeds. This is due to the fact that they reflect speed limits not only by the design of the rolling stock, VSP parameters and curves, but also by the state of devices and structures (deformation of the subgrade, skew of the contact network supports, etc.). In addition, they are adjusted taking into account planned track repairs, reconstruction and reorganization of structures and devices, etc.
After construction, the context diagram is detailed using the first level decomposition diagram. This diagram shows the functions of the system that must be implemented within the main function. The diagram for which the decomposition is performed, in relation to the diagrams detailing it, is called parental . The decomposition diagram with respect to the parent is called subsidiary .
The decomposition diagram of the first level for the problem under consideration is shown in Fig. 6.22. As a rule, when constructing a decomposition diagram, the original function (decomposed) is divided into 3–8 subfunctions (blocks). At the same time, it is recommended to place the blocks on the decomposition diagram from left to right, top to bottom, so that the sequence and logic of interaction of subfunctions can be better seen.
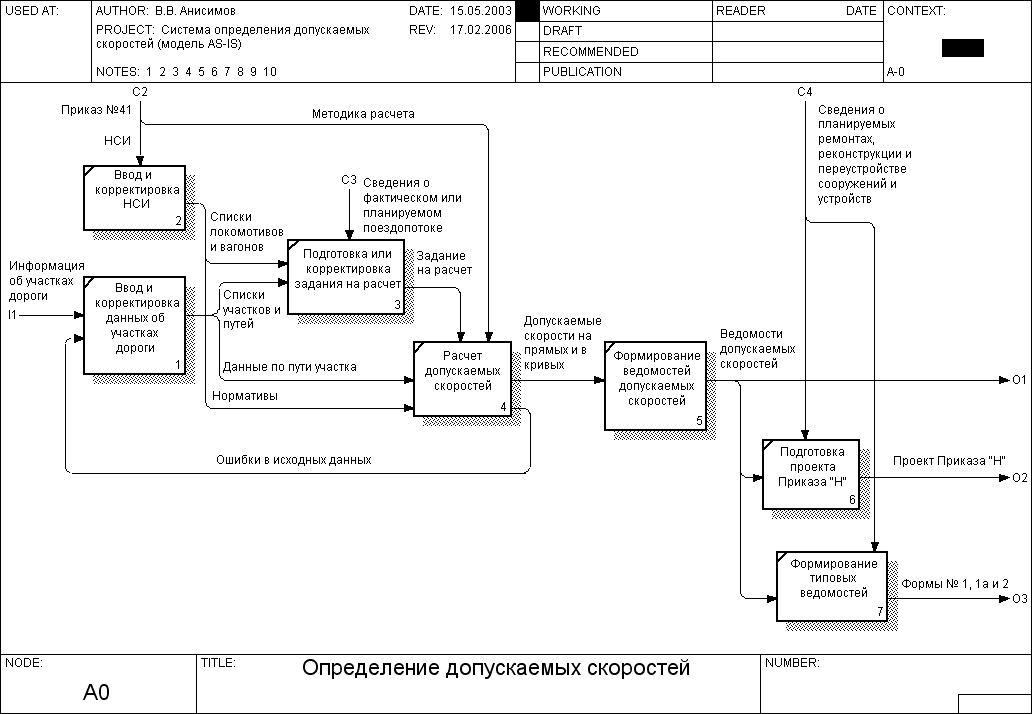
Rice. 6.22. First level decomposition diagram (IDEF0 methodology)
The order of execution of functions for solving the problem under consideration is as follows:
Entering and updating reference information and data on road sections (blocks 1 and 2);
Preparation of a task for calculation (block 3). It indicates for which section and track, as well as the brand of the locomotive and the type of wagons, the calculation should be performed;
Calculation of permissible speeds in accordance with the procedure and formulas specified in Order No. 41 (block 4). The source information is data on the path of the section (plan, superstructure of the path, etc.) and standards selected on the basis of the task for the calculation;
Formation of statements of permissible speeds (block 5). Based on the results of the calculation, several types of output documents are created, which, on the one hand, make it possible to identify the cause of speed limits, on the other hand, act as the basis for the preparation of regulated documents;
Formation and preparation of the draft Order "N" and standard statements (blocks 6 and 7).
After constructing the decomposition diagram of the first level, separate diagrams are constructed for the functions indicated on it (decomposition diagrams of the second level). Then the process of decomposition (building diagrams) continues until further detailing of functions does not lose its meaning. For each atomic function that describes an elementary operation (i.e., a function that does not have a decomposition diagram), a detailed specification is compiled that defines its features and implementation algorithm. Flowcharts of algorithms can be used as an addition to the specification. Thus, the process of functional modeling consists in the gradual building of a hierarchy of functions.
6.7. ICOM codes
The arrows entering and exiting the block in the top-level diagram are the same as the arrows entering and exiting the lower-level diagram, because the block and the diagram represent the same part of the system (see Figure 2). And ). As a consequence, the bounds of the top-level function are the same as the bounds of the decomposition diagram.
ICOM codes (abbreviation for Input, Control, Output and Mechanism) are used to identify boundary arrows. The ICOM code contains a prefix corresponding to the type of arrow (I, C, O or M) and a serial number (see figure).
 Discounted payback period
 Methodological aspects of project management
 Scrum Development Methodology