Application of the index of profitability
In this article, we will look at another project performance indicator that is widely used to support the selection of alternatives. This is the profitability index. This indicator, like other criteria of the historically established group of parameters, is closely related to NPV, being its derivative. The net present value, while having undeniable advantages, however, does not allow us to see the degree of investment efficiency. Therefore, it is quite logical that a relative evaluative parameter, PI, arose nearby.
Relative Performance Evaluation Logic
Let us recall the main postulates of the effectiveness of investment tasks. Investments and the accompanying organization give impetus to the generation of project cash flows. These flows must meet the condition of sufficiency for the return on investment and additionally the expected return. The basic assessment methodology is based on the use of a group of indicators, which are divided into static and dynamic criteria. The latter indicators take into account the time value of money. Below you will find a classification scheme for the assessment indicators that we are talking about.
In addition to the position of dynamism, the indicators also differ in terms of absolute values of efficiency and its comparative (relative) assessment. The profitability index just serves the task of comparing one investment project with another due to the relative nature of the method used in it. The indicator, by its economic essence, characterizes the level of profitability growth for each ruble of investments made.
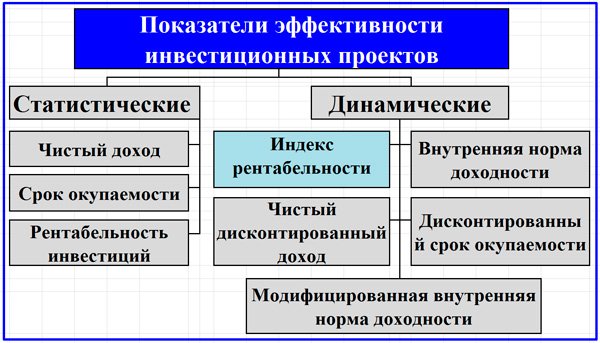
Classification scheme of indicators of efficiency of investments in fixed assets
The main variations of the name of the indicator in question are:
- Profitability index (PI);
- profitability index;
- profitability index.
The criterion for the expediency of an investment is satisfied with a PI value above 1.0, which at the same time characterizes the NPV indicator exceeding zero. The method allows you to calculate the return on investment index and, on its basis, perform the selection and ordering of independent activities in conditions of budgetary constraints on capital investments and additional sources. PI eliminates the lack of net present value, which makes it difficult to objectively assess when comparing projects with different investment costs at the same NPV. Let us illustrate the described situation, for which a small example is given below.
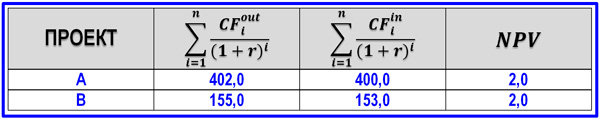
An example of a comparative analysis of two projects with a single NPV level
In connection with the presented example, let us ask the question: for which of the options is the price of an error related to cash flow planning or the discount rate higher? Obviously, the smaller the scale of money turnover, the greater the impact of the error (option B). Therefore, quite naturally there was a method for calculating the return on investment index, taking into account the ratio of discounted net cash flows to the amount of total investment.
PI Calculation Formulas
As we have already determined, the return on investment index can be calculated as the ratio of the cash flows NCF or simply CF of all steps of the project period to the investment. By investments, we mean initial capital investments or their entire aggregate, if the investment process takes a long period and covers more than one time interval. We immediately say that we are considering exclusively discounted profitability index, i.e. dynamic version of the indicator.
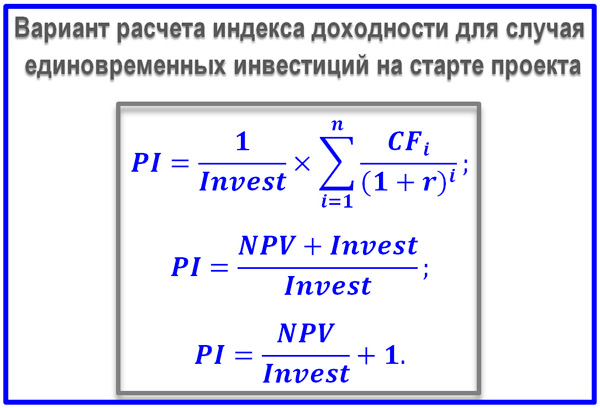
The formula for the return on capital investment index for one-time investments
Above is the PI formula for the case when the investments were made at the start of the investment project, and there is no need to discount their value. There are several options for such formulas, but the essence is the same: we find out how much net cash flow arose taking into account the change in the value of the DS per 1 ruble of capital investments made. An indicator equal to 1.0 necessarily requires additional analysis of the project. If PI> 1.0, then the investment is effective, while comparing several projects, preference, of course, should be given to an event for which the return on investment index is higher.
Next, we propose a formula for calculating the PI value for the case when investments are made in several iterations, covering several time intervals. In order to use formulas correctly, you need to remember the traditional structure of Cash Flow. It consists of the local parts of the cash flow responsible for operating, financial and investment activities as part of the company's DS turnover. The numerator parameter CFi can be calculated from two points of view. The first position is based on the concept of economic profit (after payment of statutory taxes).
![]()
Classic PI Formula
The NCF (Net Cash Flow) indicator can be calculated indirectly by adding depreciation deductions and other non-cash expenses to net profit. The second point of view on the issue of calculating CFi is based on a direct calculation method. Putting together the Cash Flow for the three types of cash flows as a result of the investment project, we get NCFi. From this value, for the purposes of calculating CFi, the amount of investments made and dividends planned to be paid in connection with the event should be deducted.
PI Calculation Example
The discounted profitability index is best illustrated with the example of a decision on the composition of the company, which must include a limited set of projects that meet a number of conditions. Among such conditions, one of the dominant ones is often the return on investment. Let's consider an example of calculating this indicator for a situation where the total budget is limited to 130,000 million rubles.
After the initial selection, 9 projects passed through the business planning procedure. The example assumes that they all meet the criterion NPV> 0. Let's compile a table of the values of the amounts of investment investments given at the accepted discount rate, and the corresponding reduced receipts of funds for all time intervals. For each task, we calculate the return on investment index and rank the projects according to the PI criterion.
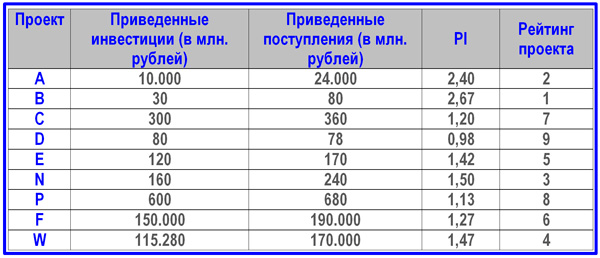
An example of ranking projects according to PI for the subsequent formation of a portfolio
In this case, the above proceeds are understood as just NCF minus investment costs and dividends associated with the project. Based on the completed PI rating, we will recruit projects into the portfolio until the budget of 130,000 million rubles is reached. There were four such events, and the total NPV amounted to 68.850 million rubles (194.320-125.470).
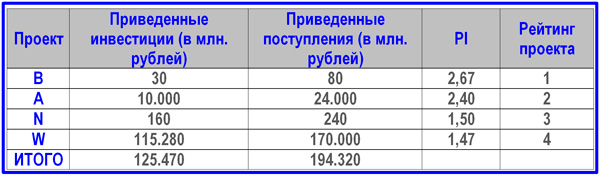
Example of a PI-based investment budget
We conclude this article by highlighting the strengths and weaknesses of PI for measuring performance. As we have noticed, the use of the profitability index method is relevant for the formation of tactical and strategic portfolios of the company's investment decisions. If we compare two alternative projects with equal NPV, then for correct conclusions we cannot do without using a relative parameter. Among the shortcomings, it is worth noting the incorrect assessment of mutually exclusive tasks and the high sensitivity to the scale of projects. However, as a derivative, complementary PI indicator is very convenient and useful.
 Discounted payback period
 Methodological aspects of project management
 Scrum development methodology