Stakeholder map - a tool for analyzing the project environment and the business as a whole
The concept of a stakeholder (a stakeholder, a stakeholder) in a business as a whole or in a particular business project, as an individual or legal entity that can positively or negatively affect the conduct of business or the progress of a project, is intuitively known to every business leader, every manager project.
The concept of stakeholders and the principles of working with them have found a systematic presentation in the works of Western researchers.
The concept of a stakeholder (Stakeholder), which is much broader, is sometimes confused with the concept of a shareholder (Shareholder or Stockholder). The authors of the “Stakeholders” section of the 12manage.com website include the following as the main stakeholder groups:
- shareholders and investors;
- lenders: banks and other credit organizations;
- partners and suppliers;
- buyers and clients;
- managers and senior management of the company;
- company personnel;
- trade unions;
- competitors;
- government and tax authorities;
- professional associations;
- mass media;
- non-governmental organizations;
- public ecological, religious and other organizations;
- local communities.
Obviously, this impressive list does not exhaust the list of all individuals or legal entities that can affect the business. The concept of stakeholders, who form both the economic and human, psychological environment of a business or a separate project, is so important that the renowned management specialist Edward Freeman formulates the key and only goal of any organization as achieving a balance of interests of stakeholders (cited by).
The concept of stakeholders is absolutely critical in project management, where the environment is highly dynamic. Some large companies' corporate project management methodologies mandate that the project's key stakeholders be listed and their requirements for the project are listed in the project baseline (usually in the communications plan section). This is how David Cleland defines the concept of project stakeholders:
Stakeholders (stakeholders, equity holders) of the project are people (organizations) or groups of people who have, or think they have, legal requirements in relation to certain aspects of the project. The purpose of interest can be to secure personal interest, share in participation, or put forward requirements for the project; this goal can range from satisfying an informal interest in the process of participating in a project to making legitimate claims.
The cited definition implicitly implies a very important idea: the attitude of this or that stakeholder to the project is characterized not only (we will allow ourselves to focus the reader's attention on this) and not so much by objective economic prerequisites, but, on the contrary, by a subjective attitude to the project, business in general, or (which is very critical) to the leader of this business or the project manager.
The literature describes quite well the toolkit for analyzing stakeholders at an objective level: division into internal and external stakeholders, primary and secondary, “influence-dynamism”, “influence-interest” matrices, and so on. The tools and approaches we offer are the development of the ideology of the analysis of stakeholders of the Strategic Management Group (SMG) consulting company and, to a certain extent, are focused specifically on the personal psychological analysis of the business environment or a separate project.
Analysis of any group of objects, events or phenomena (such as operational or project risks in risk management) begins with their identification. Stakeholder analysis can be carried out independently by the business or project leader, in the process of personal consultation with a consultant or coach, or in a group format (for example, at a meeting of the Core Project Team - the project coordination group). In the latter case, if the group members do not know the toolkit for stakeholder analysis, they need the help of an experienced facilitator, whose task is not to offer the group ready-made solutions, but to manage the analysis process and explain the "subtle" points of working with the tools.
Both the leader and the group, not to mention the consultants and facilitators, should form a clear understanding that the use of stakeholder analysis tools does not provide any additional information about the business or project environment, but only allows you to systematize what is already available, sometimes translate it from the subconscious level to the level of conscious perception, and, based on this systematized, "sorted out" information, outline an adequate strategy for working with stakeholders. Therefore, all the proposed tools are essentially tools for visualizing information about the environment of a business or project, allowing you to transfer information from "subconscious" to "conscious codes".
In this paper, we will look at four well-proven tools:
- stakeholder's Map,
- interests table,
- matrix "support × power of influence",
- an integral measure for assessing the business environment (or project environment) is the formula of Alexei Pirogov.
The last formula was developed during the training with the employees of "Probusinessbank", conducted by the first of the authors. The assessment methodology used in this tool was proposed by Alexey Pirogov, Vice President of Probusinessbank.
A stakeholder map is a tool that allows you to most adequately identify stakeholders. The very concept of "map" leads us to the question of the relationship between symbol and object. The expression of Alfred Korzybski, who laid the foundations of general semantics, is widely quoted by theorists and practitioners of neurolinguistic programming: "A map is not a territory." That is, an abstract construction derived from an object, or the subject's reaction to it, is not the object itself. Thus, a stakeholder map is a subjective representation (image) of an individual (leader) or group about the business or project environment. This image is displayed graphically in the form of some scheme (figure). The stakeholder identification process is somewhat meditative. If the work is done in a group format or in the format of a personal consultation, then the facilitator or consultant offers to present to the group (or the person being consulted) the sky, in the center of which the leader ("luminary") is placed. Stakeholders are analogous to "stars" in the sky. At this stage, the main task is not to let out of the field of vision the stakeholders, individuals or legal entities, who can influence with a “plus” or “minus” sign on the conduct of the business or the implementation of the project. Brainstorming technology is applicable to the process of identifying stakeholders in a group format (for example,). At the same time, each participant in the session has his own visual picture of the environment of the business or project. Some of the "stars" are closer to the "luminary", some further. Here the consultant or facilitator should ask the question on the basis of what principle the participants in the session placed the stakeholders in this or that proximity to the leader. As a rule, the answer given by the participants of the sessions is: "The more important this or that stakeholder is to us, the closer we have him to the leader." The principle traditionally laid down in the visual image of the stakeholder map is completely opposite to the declared one - the degree of proximity expresses the degree of the leader's ability to influence a particular stakeholder.
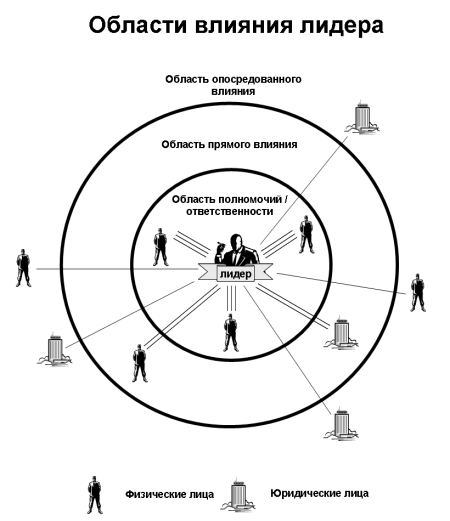
In fact, there are three concentric areas on the mental map (Fig. 1):
- Area of authority / responsibility. In this area, there are stakeholders who are directly subordinate to the leader. And the most primitive strategy of the leader's relationship with this stakeholder may be administrative coercion (order). It should be well understood that many projects, especially in large organizations, are carried out within the framework of the so-called weak matrix organizational structure, when the members of the project team are not functionally subordinate to the project manager. In this case, this area may be empty when analyzing the design environment.
- Area of direct influence. There are stakeholders who do not obey the leader, however, in accordance with his status, the leader can use the strategy of exchanging resources (“you - me, I - you”) or beliefs when building relationships with them. At the same time, outright manipulation is not excluded. As applied to project management, the direct influence includes members of the project team who are not functionally subordinate to the project manager, other company employees whose hierarchical status is not much higher than the manager's status, the project curator, suppliers and contractors (if the manager works directly with them) , clients of the company (if the manager works with them directly).
- Area of indirect influence characterized by the fact that the leader is practically devoid of tools of direct influence on this stakeholder. The very meaning of the adjective mediated indicates that in order to influence the stakeholder, the leader is forced to use the support of a stakeholder who is in the area of his authority or in the area of direct influence. In project management in relation to the project manager, in a typical situation in this area, there may be a project sponsor, almost the entire top management of the company, representatives of government agencies, competitors.
 Rice. one.
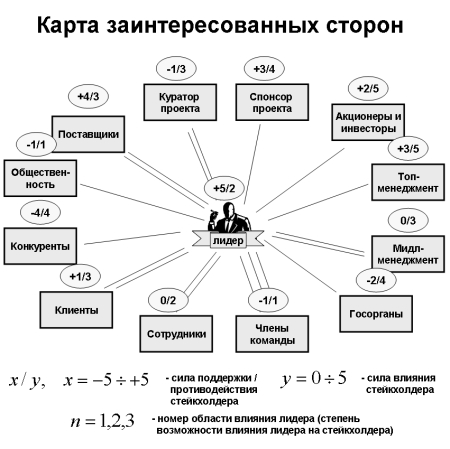
As you might guess, the formal list of stakeholders in a business or project environment is huge, and when graphically visualizing a stakeholder map (for example, when displayed on a flip chart in a group work), geometric partitioning according to the principle of "closer - further" can greatly complicate the picture. It is recommended to connect the figure of the leader ("luminary") with stakeholders ("stars") with triple (area of authority / responsibility), double (area of direct influence) or single (area of indirect influence) lines, neglecting the original geometry (Fig. 1 and 2) ... Thus, the number of lines n = 1,2,3 characterizes the degree of the leader's ability to influence the stakeholder.
As usually happens when using brainstorming technology, the resulting stakeholder map may contain unnecessary, irrelevant information. The method of cutting off "noise" information is expert assessment by the consultant or a group of the "parameters of importance" of stakeholders.
 Rice. 2.
“Importance” is assessed on two scales (x / y in Fig. 2), where x = -5 ÷ +5, with a step of 1 (or smaller) characterizes the degree of support / opposition by the project stakeholders, business in general, or the leader personally (! ), (–5 - the extreme degree of opposition, +5 - the highest degree of support), y = 0 ÷ 5 with a step of 1 (or smaller) characterizes the degree of influence of a stakeholder on a project, business or leader. At the same time, you should not mechanically cut off stakeholders with zero values of the degree of support / opposition or the strength of influence, since, as we will see later, zero values can be triggers (signals) of risks coming from the project environment.
It should be borne in mind that the leader himself is the most important stakeholder and must give a self-assessment in terms of x / y parameters, which will show (in case of sufficient frankness with the consultant, group and facilitator) the degree of his interest in the business (project), as well as a subjective assessment of the possibility of management this business or project.
It is the circuit shown in Fig. 2, and in the classical interpretation is called “stakeholder map”.
For small companies doing business locally, the power of influence of internal stakeholders in relation to the leader of a separate project, all other things being equal, can be assessed in accordance with the following principle:
- y = 5 - the first persons of the company (president, CEO, members of the board of directors),
- y = 4 - second persons of the company (vice presidents),
- y = 3 - heads of functional departments,
- y = 2 - middle managers,
- y = 1 - line managers.
This principle, obviously, ceases to work when it comes to a large geographically distributed holding.
A stakeholder map built in this way allows you to visualize the threats posed by the project environment. Consider fig. 2. As for the threats posed by the “competitors” stakeholder, they are quite obvious. The situation with the stakeholder “government agencies” is less obvious. The attitude of the “government agencies” to the business or project of the stakeholder is weakly negative (x = -2), the power of influence is quite tangible (y = 4), and the possibility of the leader's influence on this stakeholder is minimal (n = 1).
The stakeholder map shown in Fig. 2 is illustrative, so those who use this tool for the first time should be warned against the temptation of an unnecessarily “enlarged” representation of stakeholder groups (“the public”, “government agencies”, “suppliers”, etc.) It is clear that within a certain group there are legal entities (Organization A or Organization B) will have completely different "parameters of importance". At the same time, with regard to legal entities, it is extremely useful to indicate on the diagram the decision makers (individuals who make decisions).
There is also one delicate aspect worth paying attention to. Building a stakeholder map for a business or project demonstrates the leader's understanding of his environment. Although, as we have noted, this tool can be used in a group format, this “understanding” should not be made public, for example, within the organization as a whole. If the leader (project manager) rates two high-profile persons of the company, for example, +3/4, 0/3, then there is the greatest risk that the latter will try to demonstrate to the unlucky leader the power of his influence on the project, which significantly exceeds his real powers.
A schematic diagram of working with a stakeholder map is spelled out in table. one.
| Actions | Questions |
|---|---|
| Formulate business goals or project goals. Identify stakeholders. | Do all stakeholders understand the goals of the business / project in the same way? |
| Build a stakeholder map and determine the degree of opportunity to influence stakeholders (n = 1,2,3). | If the opportunity to influence is not enough, what is the reason? No appropriate authority or contact with this stakeholder? |
| Assess the strength of support / opposition by a business or project stakeholder (x = -5 ÷ +5). | What are the stakeholder interests in relation to the business / project? |
| Assess the strength of the stakeholder's influence on the business or project (y = 0 ÷ 5). | Does the obtained expert judgment correspond to the natural “hierarchical structure”? |
Tab. one.
The tools listed along with the stakeholder map in the above list (the table of interests and the “support × power of influence” matrix) are often considered auxiliary, but they carry an additional semantic load.
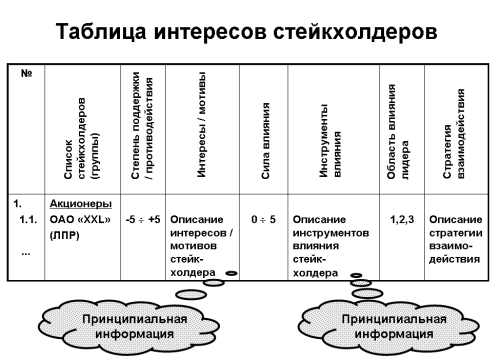
Let's consider the principles of using the table of interests (Fig. 3). The information obtained during the construction of the stakeholder map, of course, can be presented in a tabular form. At the same time, based on the obtained assessment of the degree of support / opposition by the stakeholder of the business or project, the assessment of the strength of its influence on the business or project, as well as the assessment of the possibility of influencing the stakeholder, it is possible to develop a strategy for interaction with this stakeholder. However, often (especially if the leader uses the described tools without the help of a consultant) these assessments are formed on the basis of absolutely formal considerations. For example, at meetings of project teams devoted to the analysis of the project environment, one can hear the following statements: "The president of the company supports this project (x = +5), since the project is aimed at bringing to the market an innovative product that promises fabulous profits for the company." In this case, not only the conclusions of professional experts, who gave a negative assessment of the technological or marketing component of the project, can be ignored, but also the personal attitude of the first person of the company to the project.
 Rice. 3.
In the interests table, the columns “stakeholder interests” and “instruments of influence” play an important role. These columns are a kind of tests for the consistency of the given estimates. If the information in them corresponds to the true state of affairs, then the obtained expert assessments will be adequate. In addition, understanding the interests of the stakeholder and describing the tools of his influence on the business or project will help develop an optimal strategy for interacting with him.
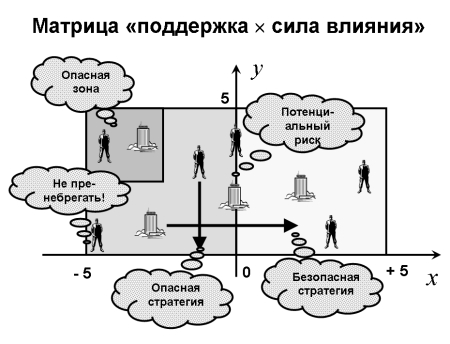
The “support × influence power” matrix is an xy coordinate system on a plane on which stakeholders are placed inside the rectangle -5 ≤ x ≤ +5, 0 ≤ y ≤ 5 in the form of conventional symbols (Fig. 4). At first glance, the resulting picture does not add anything new to the structure of information about the environment of the business or project. However, it is not. The stakeholders located in the upper left corner of this matrix (relatively speaking, -5 ≤ x ≤ +2, 2.5 ≤ y ≤ 5) pose the greatest threat to the leader.
You should also not neglect working with stakeholders with minimal power of influence, but with an extreme degree of opposition to the business or project. One of the reasons is that these “minor” stakeholders can be used as a tool to put pressure on the leader by other stakeholders whose positions are not clear or are not voiced for political reasons (x = 0), and the power of influence is quite large. Thus, zero values of the "importance parameters" x and y can signal potential risks.
 Rice. 4.
If earlier (for example, in the table of interests) a strategy of interaction with a stakeholder was prescribed, then when working with the matrix "support x power of influence" it is necessary to answer the question of what this strategy is aimed at. The “parameters of importance” of stakeholders, as mentioned above, have two components: the strength of support / opposition and the strength of influence. In theory, in order to reduce the negative impact of a certain stakeholder on a business or a project, the strategy of interaction with him can be aimed either at increasing support or at reducing the power of influence. However, the latter strategy is quite dangerous, since it obviously leads to a conflict.
There are many definitions of conflicts in the literature. For example, Olga Allakhverdova and Alexander Karpenko define conflict as psychological emotional (fear) and cognitive (misunderstanding) tension arising as a result of real or imagined (expected) infringement of their interests by the other party.
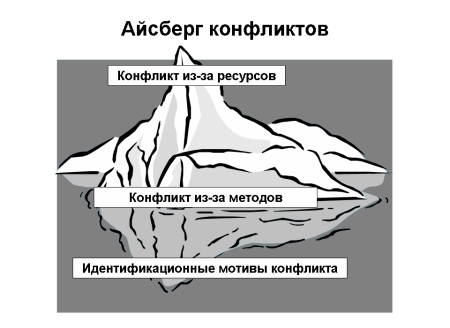
If we are talking about an intra-company, industrial conflict, then the sources of its occurrence can be described using a simplified model called the iceberg of conflicts. At the tip of the iceberg, that is, the open position of the conflicting parties, lies a conflict over resources. A typical situation develops in project work under the conditions of a matrix organizational structure of a company, when human resources are under double subordination to the head of the functional unit and the project manager. The borderline source of conflicts, conflict over methods, lies at the "watershed", when, for example, the parties to the conflict - the functional manager and the project manager - cannot agree on the priority of the tasks performed by the employee. However, the most serious sources of conflict, identification motives, lie in the underwater part of the iceberg and are latent. These include values, beliefs, negative attitudes and stereotypes of behavior, the accumulated experience of the individual. These identification motives are transformed into conflict factors: structural (for example, based on the differences in psychotypes of the conflicting parties, on gender differences), informational (when hidden information gives rise to numerous interpretations and assessments), value factors, relationship factors (arising from negative attitudes) etc .
 Rice. five.
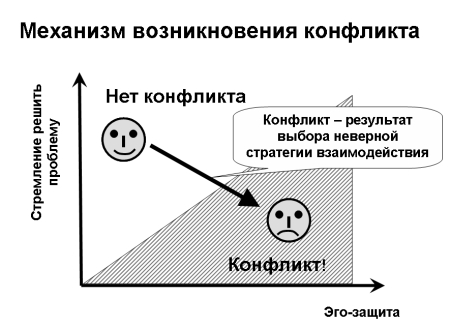
In fact, the behavior of an individual in a conflict situation can be conditionally decomposed into two components: the desire to solve the problem underlying the conflict situation and ego defense (Fig. 6). We will not give a rigorous psychoanalytic definition of this intuitive term, which goes back to Sigmund Freud. In fact, conflict as such (see the above definition from) does not arise until ego protection prevails over the desire of the parties to the conflict to find a solution to the problem. We can talk in this case, for example, about the inability to maintain a balance of interests, ignorance of the methodology for making decisions (Decision Making) and so on. In other words, a classical conflict arises only when identification motives (the underwater part of the iceberg) are contained among the sources of its occurrence. The stages of development of organizational conflicts are well known and described in the literature. The complexity of their settlement is such that already at fairly early stages, the resolution of the conflict is impossible without the participation of an external mediator.
 Rice. 6.
It is quite obvious that the choice of a strategy for interaction with a stakeholder, aimed at reducing the strength of his influence, brings this stakeholder into the conflict zone shown in Fig. 6. Similarly, the strategy of completely ignoring stakeholders with a very high degree of opposition to a business or a project, but with a low power of influence generates additional “human risks”. Ignoring the individual automatically indicates his low status and turns on the mechanisms of ego defense. And if at a certain moment the influence of a given stakeholder increases, then he will immediately fall into a dangerous zone (upper left corner of the “support × influence power” matrix, Fig. 5), after which building relationships with him becomes very problematic.
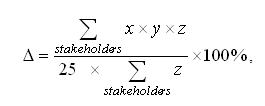
The last analytical tool, which will be considered in this article, we conditionally call the Pirogov formula. During the training with the employees of Probusinessbank, the vice-president of the bank, Alexey Pirogov, raised the question of the possibility of creating some integral measure that characterizes the business risks generated by the human factor. Earlier, the listeners analyzed several projects of the bank in the field of improving the IT infrastructure by building a stakeholder map. The formula proposed by Alexei Pirogov, and corrected during the discussion in the group, is as follows:
where 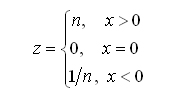
In the above formula, the summation is carried out for all stakeholders, excluding the leader himself. Thus, this model evaluates only risks external to the leader of a business or project, without taking into account his own motives (expressed openly or deep, hidden). The value x in the numerator characterizes the degree of support / opposition by the stakeholder of the business or project, the value of y is the strength of the stakeholder's influence on the business or project, the value z is the leader's ability to influence the fate of the business or project, that is, if the attitude of the stakeholder is positive, then the leader is using his capabilities , increases the effect of support (multiplied by n), if negative, then the leader tries to reduce the effect of counteraction (dividing by n).
The denominator is the normalizing factor (that is, ∆ = -100 ÷ +100). Indeed, the worst option for a business or a project of maximum opposition from stakeholders with the maximum power of influence (x = ‑5, y = 5) gives the value ∆ = -100%; the best, when the stakeholders with the maximum power of influence support the business or project as much as possible, (x = +5, y = 5) gives ∆ = + 100%.
After this formula was "approved" by the participants of the training, the trainees calculated the integral risk measure ∆ for the projects considered earlier. It turned out that projects initiated “from the bottom”, integrally receive a much lower degree of support, despite the formal approval of the management, in comparison with projects initiated “from the top”.
This model is quite tolerant of the leader's figure and implies that he is able to use his capabilities to the fullest. Due to this circumstance, the model is asymmetric. To assess its consistency, a test case "Company" Immobility "was developed, which is currently widely used in trainings by CBSD Thunderbird Russia. The group of listeners is divided into two subgroups, each of which receives a description of the same business situation. The first pages of the description (general information) are absolutely identical, the subsequent ones contain confidential information that is different for different groups. Moreover, the descriptions are drawn up in such a way that for the first group the situation looks absolutely disastrous, for the second - quite favorable. The statistics accumulated using this case show that the risks of a business or project, generated by the human factor, are very high, if, on average, ∆< +10%. Если же ∆ >+ 40%, then "human risks" can be considered low.
In conclusion, I would like to make a few comments in order to form the correct attitude of readers to the tools discussed above. In recent years, Bert Hellinger's method of family constellations has become very popular in Russia (in the original, without distortions introduced by translators into Russian, the foundations of Hellinger's teachings can be read in books), which is actively transferred by consultants, adherents of the method and into other areas. The concept of business constellations, organizational constellations, and so on came into being. The essence of the Hellinger method is that during group work, one of the participants states a problem, and uses the rest (perhaps not all) as substitutes for people, organizations and other objects that affect his life. During the session, there is a slow mutual movement of the client and the proxy. The first stage is finding a certain position in which (as it is supposed) the deputies begin to feel themselves in the role of real prototypes (substitutive, field perception) in the current situation as is. At the final stage, there is a position in which all participants feel comfortable, and the client somehow gets through the final picture of the constellation a solution to the stated problem (desired situation as to be). Sometimes, not living people are used as substitutes, but inanimate objects. In fact, Hellinger's constellations are nothing more than a “revived” stakeholder map or its modification - a “support × power of influence” matrix.
The Hellinger method is very often criticized for the impossibility of substantiating the phenomenon of substitutionary perception by classical methods of psychotherapy and the lack of a broad base of confirmed scientific studies regarding the effectiveness of constellations. We will not speak out in support of the Hellinger method or against it. However, the very existence of the Hellinger method is an excellent empirical proof of the fact that a geometric model of the environment of a business or project can bring insight into the situation in which a leader finds himself. Here we have to make an important caveat: in the presence of quality information. Indeed, if you do not rely on semi-scientific and esoteric concepts, then even the experiment with the test case "Company" Immobility ", conducted in CBSD Thunderbird Russia, shows how important it is when analyzing the environment of a business or project to have adequate information obtained from adequate sources. Working with a stakeholder map, a table of interests, a support × power of influence matrix, and Pirogov's formula will not give a ready-made solution - it will first of all make you think and ask yourself numerous “why?”.
Literature
- Allakhverdova O.V., Karpenko A.D. Mediation - negotiations with the participation of a mediator. St. Petersburg: Publishing house of St. Petersburg University, 2007.
- Cleland, D. Project Stakeholder Management. In the book. "Project Management" ed. J.C. Pinto. M .: Peter, 2004.
- Panfilova, A.P. Brainstorming in collective decision making. M .: Flinta, MPSI, 2007.
- Gardner, J. R., Rachlin R. & Sweeny, H. W.A. Handbook of Strategic Planning. New York: John Wiley & Sons, 1986.
- Hellinger, B., Weber, G., Beaumont, H., Love's hidden symmetry: What makes love work in relationships. Phoenix, AZ, Zeig, Tucker & Theisen, 1998.
- Hellinger, B., Farewell: Family constellations with descendants of victims and perpetrators. Heidelberg, Germany, Carl-Auer-Systeme Verlag, 2003.
- Mitchell, R. K., Agle, B. R., Sonnenfeld, J. A. Who Matters to CEOs. An Investigation of Stakeholder Attributes and Salience, Corporate Performance and CEO Values // Academy of Management Journal (1999), Vol. 42, No. 5, p. 507-525.
- URL: http://www.12manage.com/methods_stakeholder_analysis.html
Views: 27 102
 Discounted payback period
 Methodological aspects of project management
 Scrum development methodology