Strategy map diagram
Chart window strategic map can be opened by double-clicking the left mouse button on the strategic map in Navigator or by clicking on the toolbar button Navigator. Learn more about working with the toolbar Chart windows described in the chapter.
Used graphic elements
Elements of the strategy map diagram can be added to the diagram using the buttons of the elements palette Chart windows. The description of the purpose of the buttons of the palette of elements is given in Table 1.
| Button | Purpose |
|---|---|
| Adding a new arrow. | |
| Adding a footnote. Used as an additional comment to a chart element (see ). | |
| Adding an existing target. A window for selecting an object from the "Goals" directory will open. | |
| Adding an existing measure. A window for selecting an object from the "Indicators" directory will open. |
Table 1. Buttons of the palette of elements of the chart window of the strategic map
Working with a strategy map diagram
The strategy map diagram divides perspectives into rows in which goals are placed. The title of the diagram shows the field with the name of the strategic map and the auxiliary field of the diagram (Fig. 1).
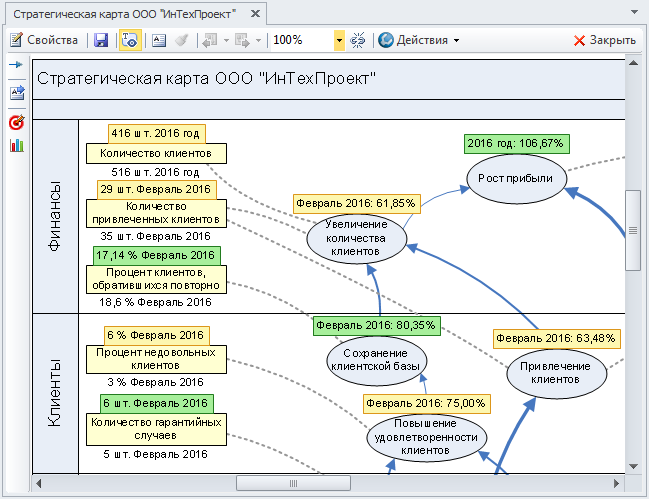
Figure 1. Strategy map diagram
To add a perspective to the diagram, drag the appropriate object from the "Perspectives of the strategy map" reference book ( Navigator→ tab Governance → Goals and indicators → Strategic map perspectives). For more information on dragging objects onto a diagram, see the article.
Perspective tracks in a chart can be positioned horizontally or vertically (horizontal is recommended). The location method is selected in the window Function block diagram, which opens once when adding the first perspective to the diagram (Fig. 2).
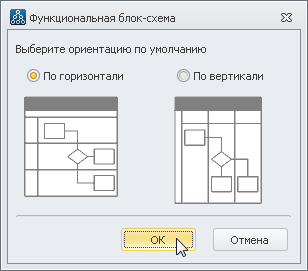
Figure 2. Window Function block diagram
To insert a strategy map perspective track between two tracks present on the diagram, move the mouse cursor just above the line separating the perspective tracks and click on the blue triangle that appears (for MS Visio 2010 only). In the window that opens, select the perspective you want to add to the diagram.
A new perspective track can be added to a diagram using the diagram track name context menu items (only for MS Visio 2010). For charts with horizontal track orientation, these menu items are called Insert "Track" before And Insert "Track" after, and for charts with vertical track orientation - Insert "Track (vertical)" before And Insert "Track (vertical)" after.
To add a goal to the chart, drag a goal from the "Goals" directory Navigator Chart windows strategic map. When you click on this button, a window for selecting a target from the "Targets" directory will open.
To add an indicator to the chart, drag the indicator from the "Indicators" directory Navigator(see ) or use the button on the element palette Chart windows strategic map. Clicking on this button will open a window for selecting an indicator from the "Indicators" directory.
On the strategy map diagram, the goal is displayed as an oval. The target can be placed in the row of the perspective to which it belongs. At the same time, the "Strategic perspective" parameter will be automatically filled in for the target. When you move a target from one perspective track to another perspective track, the value of this parameter changes.
On the strategy map chart, the indicator is displayed as a rectangle.
The dimensions of the elements of goals and indicators on the diagram can be changed using the labels on the faces of the selected element (see ).
The goal and indicator on the chart can be replaced using the context menu item Change object.
Relationships between goals and indicators on a strategy map diagram
Links on the strategy map diagram are displayed with arrows. You can add an arrow to the chart using the button. The arrow created in the diagram is not yet a link between objects and has no properties. After attaching both ends of the arrow to the elements in the diagram (Fig. 3) and after saving the diagram, an object link is created.
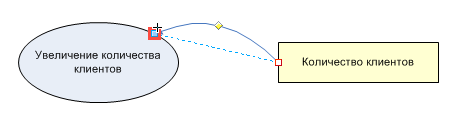
Figure 3. Attaching an arrow to a target
At the time of saving the diagram, all new links will be saved in the database. These links will be visible on the corresponding tabs in Properties window goals and indicators, and for such a link, the name of the chart to which it belongs will be displayed in the "Diagram" parameter.
Rules for creating links on a strategy map diagram:
the link can go in and out of the target;
a connection can only go out of the indicator, but cannot enter it;
a link cannot connect the same object.
Links in the diagram can be of two types: links of indicators and links of goals.
Metric links- these are the links of indicators with goals. These links are displayed:
V Properties window goals on the tab Indicators;
V Properties window indicator on the tab Goals.
Goal links- these are the connections of goals with goals. For example, in a strategy map diagram, Goal 1 and Goal 2 are linked by an arrow pointing from Goal 2 to Goal 1. The connection of goals "Goal 1" and "Goal 2" will be displayed:
V Properties window goals "Goal 1" tab Depends on goals;
V Properties window goals "Goal 2" tab Affects goals.
To link an indicator to a goal or a goal to a goal, the "Strength of influence" parameter is filled in, showing the degree of influence of the indicator on the goal or goals on the goal (Very weak influence, Weak influence, Normal influence, Strong influence, Very strong influence). After the link is created, this parameter defaults to Normal Influence. IN Properties window connection, the value of the "Strength of Influence" parameter can be changed. To open Property windows link click item Object properties in the context menu of the arrow that displays this connection in the diagram, or select the arrow and click the button on the toolbar Chart windows. When changing the value of the "Strength of Influence" parameter, the thickness of the arrow that displays this relationship in the diagram will change (Fig. 4).
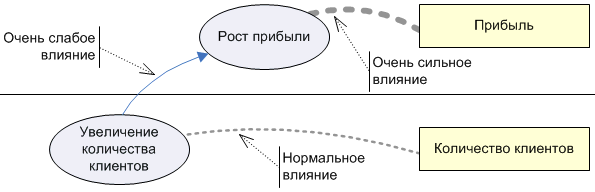
Figure 4. The dependence of the thickness of the arrow and the value of the parameter "Strength of influence"
More details about graphical change of the arrow are described in the article.
The color of the arrow can be changed using the context menu item Line (Context menu arrows → Format → Line) (Shift+F3). More about assigning context menu items Chart windows described in the article.
Attention!
The number assigned to the value of the "Strength of Influence" parameter in connection with the indicator and the goal is used to calculate the assessment of the achievement of the goal (for a more detailed description, see the article → ). In all links of one indicator with one goal (for example, the relationship between an indicator and a goal can be present on different strategic maps), the strength of influence should be the same. If the forces of influence in the links of the same indicator with the same goal differ, the calculation of the assessment of the achievement of this goal will be incorrect.
 Discounted payback period
 Methodological aspects of project management
 Scrum Development Methodology