Construction of a strategic map and selection of indicators of the SSP
After the stage of defining and selecting strategic goals, one should proceed to determining the links between the goals - building a strategic map. What are the practical benefits of building a strategic map:
- determines the links between different goals, an important aspect is to determine the strength of these links.
- explains the change arising in a given system, and the mutual influence on other goals.
- contributes to a better perception and understanding of the links between the elements of the strategic map.
The construction of a strategic map is proposed to be carried out according to the following methodology:
- definition of links
- highlighting strategically important connections, determining the strength of influence
- Documentation of links and entering into CIS.
Before starting work, I propose to pay attention to the following points: A strategic map is a system.
The term "system" is used in those cases when they want to characterize the object under study or design as something whole (single), complex, about which it is impossible to immediately give an idea by showing it, depicting it graphically or describing it with a mathematical expression (formula, equation, etc.). ), and want to emphasize that this is something big, complex, and at the same time whole, unified. The concept of a system emphasizes orderliness, integrity, and the presence of certain patterns. There are dozens of definitions for this concept.
[Theory of systems and system analysis in the management of organizations: Handbook: Proc. allowance / Ed. V.N. Volkova and A.A. Emelyanov. - M .: Finance and statistics, 2006. - 848 s]
A system is a set of interconnected objects organized by links into a single whole. [Wikipedia]
Chernyak Yu.I. complements the definition with the concept of an observer: "The system is a reflection in the mind of the subject (researcher, observer) of the properties of objects and their relations in solving the problem of research, knowledge."
The definition of relationships is proposed to be carried out according to the "cause-effect" method, for this you need to build a form:
For each goal, a form is filled in, at the output we get a mathematical model in which when one element changes, the system changes.
There are two ways to present the form at the meeting and fill out the form during the discussion. Or distribute the forms to each participant, and then, in the process of processing, highlight the average values for each goal. Because this method can be described as "brainstorming" - "expert assessments" can involve more experts.
Undoubtedly, this method is the most complete and complex, subjectivity error arises. You can simplify the method by limiting yourself to notes about whether a change in one goal relative to another will have a positive or negative effect. You can use the Probst Gomez model:
Also in this model, the temporal nature of the links is determined.
Because even in the classic model for a commercial organization, Norton and Kaplan define the financial perspective to the highest hierarchical level, it is possible to determine the connections from the outside, how a certain goal affects financial goals.
However, whichever way you go, the result will be a goal map with lots of connections.
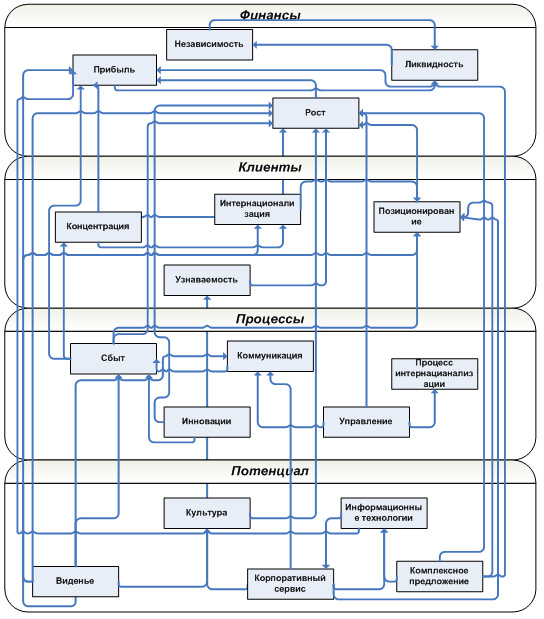
The output is a map with many cause-and-effect relationships, of course, such a map should be left but it should not be used, the presence of many connections distracts from more strategically important ones, and is not perceived by the participants, especially at the operational level.
The next step should be to leave only the most important links of a strategic nature, if work was carried out with a form with coefficients of influence, then the task is simplified, only those goals that are more strategic in nature and have the strongest impact on other goals should be left.
It should also be mentioned that determining the correlation between goals and their connections is a rather subjective issue, if you give each manager an initial map, then in many cases, the choice of more important relationships will be different, each manager concentrates on his area of responsibility. At this step, the main thing is the consensus between all participants and the balance in relationships.
I will give an example of a strategic map of the Crown Castle company. Crown Castle International is the world's leading provider of wireless communications and broadcast infrastructure. The company rents towers, leases antennas and provides its capabilities to well-known information and communication service providers and broadcasters, including British Telecom, Verizon, Cingular, Vodafone, T Mobile (Deutsche Telecom) and the BBC, for which it provides full range of broadcasting services. Crown Castle serves over two-thirds of the US markets and 90% of the British and Australian population. The corporation's revenue for 2009 amounted to 1685 million dollars.
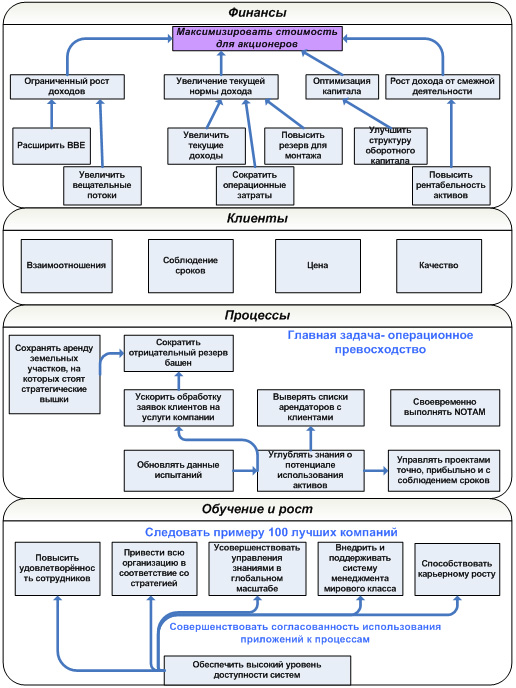
In 2003, with the participation of the district offices, the strategic map was revised, the company directed all efforts towards achieving operational excellence and decentralization of management. The strategic map has been slightly changed to more clearly demonstrate the most important areas of activity. The result is a more accessible strategy map for employees to guide them through strategy implementation.
For example, a company has introduced a new goal; “Increase knowledge of asset utilization potential” By having more updated information about towers (available space and technical specifications), a company can maximize their efficiency and improve customer service. As customers appreciate when downtime and outages are kept to a minimum, the goal to “build and improve core capabilities and support processes to maximize efficiency” becomes clearer, as does the goal to “Fill NOTAMs (Notices of Failure) in a timely manner.” [Golden Pages. Best examples of the implementation of a balanced scorecard: a collection of articles, M. Gorsky A. Gershun, 2008, M Olymp-Business]
Because the corporation's revenue increased from $900 million. in 2003 to 1685 million dollars. in 2009, the growth was almost 90%, it can be concluded that the company's strategy is being implemented correctly.
Another example of a strategy map from Wendy's
This map is clear to both top managers and 18-year-old employees of the company. After the introduction of the BSC, the staff turnover rate decreased from 170 to 118%, the industry average is 250%. All these changes allowed the company to increase its revenue from $328 million in 2005 to $328 million in 2005. up to 1822 mln. dollars In 2008 growth of 455%
It is also possible to use two variants of strategic maps, one for top management, and one more visual for lower levels of management. The main thing is that the map is understandable to all participants.
The output should be a strategic map itself, a diagram of a strategic map with cause-and-effect relationships, passports of cause-and-effect relationships of the goal. Ideally, you will get an interactive model where you can use the scenario approach.
The next step after building a strategic map is to determine the indicators and their target values, which will determine the degree of achievement of the goals themselves. The author proposes to use seminars with project participants, as well as responsible specialists who will be directly involved in the calculation and control should be involved in the process, so that during the implementation of the project itself there would be no problems in determining any data. Of course, when choosing indicators, in each individual perspective, specialists from different departments, financial - the financial sector, customers - marketing, etc. should be more involved. What problems can arise at this stage?
– The problem with the measurability of goals.
This problem lies in two planes, many managers believe that some goals cannot be measured. Especially non-financial ones. And second, according to Michael Hammer - some companies measure what is easy to measure.
For example, what indicators are needed to evaluate the goal: “Increasing the qualifications of employees” turns out to be quite simple, the personnel department tests employees every six months, based on this, the Percentage of qualified employees indicator is calculated quite easily. But do not forget at the expense of what resources this goal will be fulfilled, “staff training costs”
– You should not use indicators that raise doubts, for example, “market share”, not all private agencies can adequately assess this indicator, it is almost impossible to do it on their own in some industries, in almost every industry there are authoritative analytical agencies, for example, Nielsen, this data can be trusted.
The question should be asked: “On the basis of what indicators will we understand that the goal has been achieved?”
As a result of the work, indicators for each goal should be determined, see fig.
|
Passport of Indicators | ||||
 Discounted payback period
 Methodological aspects of project management
 Scrum Development Methodology