IDEF0 methodology. Notation, modeling principles
In order to get to know the IDEF0 standard more closely, you need to know the following about it:
- For the construction of what types of models this standard is used.
- What elements of the graphical language are included in the notation of the standard, and what requirements for the design of diagrams exist within the framework of the standard.
- What principles of business process modeling are used in the standard (decomposition principle, complexity limitation principle, tunneling principle).
- How can the constructed diagrams be evaluated in terms of their overload and balance?
IDEF0 used to create functional model, reflecting the structure and functions of the system, as well as the flows of information and material objects, transformed by these functions.
The IDEF0 methodology is slightly different from the classic DFD business process description scheme. The main difference is the classification of the work inputs.
Classification of work inputs and outputs
The standard offers the following typing of work inputs:
- entrance... It enters the work on the left and shows information and material flows that are transformed in the business process.
- Control. It enters the work from above and shows material and information flows that are not transformed in the process, but are needed to complete it.
- Mechanism. He enters the work from below and shows people, technical means, information systems, etc., with the help of which the business process is implemented.
- results exit the block to the right.
The main elements of the diagram:
The graphical language IDEF0, the syntax and semantics of which are defined with absolute rigor, is based on blocks and arrows connecting them, which form a hierarchy of detailed diagrams.
| Element | Graphical display and the meaning |
Requirements for registration |
| Functional block |
Drawn as a rectangle. Represents a function that is defined as an activity, process, operation, action, or transformation. |
1. Must have unique identification number in the lower right corner; 2. The title must be in the verbal mood. |
| Interfacearc (arrow, arc) |
It is depicted as a unidirectional arrow. They represent data or material objects associated with functions. |
1. Must have a unique name. 2. The name must be a turnover of a noun. 3. The beginning and end of the arc can only be functional blocks. 4. The source can only be the output side of the block, and the receiver can be any of the three remaining ones. |
IDEF0 - model:
The model includes the following documents that reference each other:
- Graphical charts- the main component of the IDEF0-model, which graphically, using blocks and arrows and their connections, displays information about the simulated system. The blocks represent the main functions. These functions can be broken down (decomposed) into their component parts and presented in the form of more detailed diagrams. The decomposition process continues until the object is described at the level of detail necessary to achieve the goals of a particular project.
- Text;
- Glossary- For each element of the diagram, a set of definitions, keywords, explanations is created and maintained that characterize the object that represents this element. This set is called a glossary and is a description of the essence of this element. The glossary harmoniously complements the graphical language, providing the diagrams with the necessary additional information.
The principle of decomposition when building a business process model
1. Context diagram: purpose and point of view
Business process modeling starts with a context diagram. This diagram is called A – 0 (A minus zero). On it, the system is represented as a single block and arcs representing the environment of the system. Using the diagram, you can see the interaction of the modeled system with the external environment, all its inputs and outputs. Diagram A – 0 sets the modeling area and boundaries.
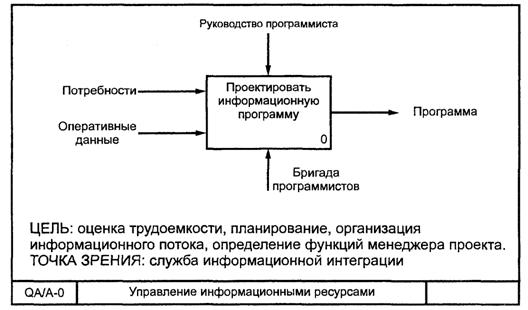 The explanatory text for the context diagram must indicate purpose plotting the diagram and fixed point of view... The point of view determines the level of detail, the direction of development of the model and allows you to unload the model. So when modeling, you can refuse to detail and study individual elements that are not necessary, based on the chosen point of view on the system.
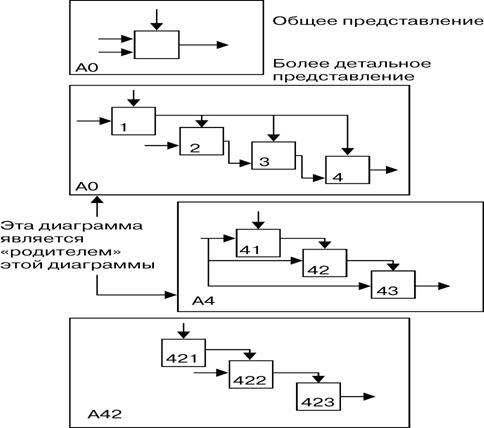
2. Detailing
Then the block that displays the entire system is detailed in another diagram.
Further, each function of the diagram can be detailed on the child. Each function is modeled in a separate block. Each parent block is described in detail by a child diagram at a lower level. This happens until a structure is obtained that allows you to answer the questions formulated in the modeling goal.
To achieve the structural integrity of the model, the following rules are used:
- All interface arcs included in this block or outgoing from it are fixed on the child diagram.
- When numbering blocks, the figure in the lower right corner of the rectangle indicates the unique serial number of the block itself in the diagram, and the designation at the right angle indicates the number of the child diagram for this block.
Tunneling principle
There are often times when individual arrows do not make sense to continue to be viewed in child diagrams below a certain level in the hierarchy, or vice versa - individual blocks do not make practical sense above a certain level. On the other hand, sometimes it becomes necessary to get rid of individual “conceptual” arrows and not detail them deeper than a certain level.
To solve such problems, the IDEF0 standard provides for the concept tunneling... The designation of a “tunnel” in the form of two parentheses around the beginning of an arrow indicates that this arrow was not inherited from the functional parent block and appeared (from the “tunnel”) only in this diagram. In turn, the same designation around the end of the arrow in the immediate vicinity of the receiver block means the fact that in the child diagram of this block this arrow will not be displayed and will not be considered.
The principle of limiting complexity
In order to limit the congestion of the models and make them easy to read, the standard adopted the corresponding complexity constraints:
- limiting the number of functional blocks in the diagram to three to six. The upper limit (six) forces the designer to use hierarchies when describing complex items, and the lower limit (three) ensures that there is enough detail on the corresponding diagram to justify its creation;
- limiting the number of interface arcs suitable for one functional block (leaving one functional block) to four.
Of course, it is not at all necessary to strictly follow these restrictions, however, as experience shows, they are very practical in real work.
Quantitative Chart Analysis: Balance Ratio and Name Scoring
To analyze the diagram in terms of its congestion and complexity for perception, quantitative analysis is used. The following indicators are used for the analysis:
- the number of blocks in the diagram - N;
- chart decomposition level - L;
- balance diagram - IN;
- the number of arrows connecting to the block - BUT.
Balance factor
It is necessary to strive to ensure that the number of blocks in lower-level diagrams would be lower than the number of blocks in parent diagrams.
Likewise, diagrams must be balanced. This means that within the framework of one diagram, a situation should not occur when there are significantly more incoming and outgoing arrows than outgoing ones.
It should be noted that this recommendation may not be followed in models describing production processes. For example, when describing an assembly procedure, a block may include many arrows describing the components of a product, and one arrow may go out - a finished product.
Let's introduce the balance factor of the diagram:
It is necessary to strive to Kh was minimal for the diagram and decreased with an increase in the level of decomposition.
Name evaluation
In addition to analyzing the graphical elements of the diagram, it is necessary to consider the names of the blocks. To evaluate the names, a dictionary of elementary (trivial) functions of the modeled system is compiled. In fact, functions of the lower, level of diagram decomposition should get into this dictionary.
For example, for a database model, the functions “find a record”, “add a record to the database” can be elementary, while the function “user registration” requires further description.
After forming the vocabulary and compiling a package of system diagrams, it is necessary to consider the lower level of the model. If there are coincidences of the names of the blocks of diagrams and words from the dictionary, then this indicates that a sufficient level of decomposition has been achieved.
The coefficient that quantitatively reflects this criterion can be written as:
L * C
— the product of the model level by the number of matches of block names with words from the dictionary. The lower the level of the model (higher L), the more valuable the coincidences.
 Discounted payback period
 Methodological aspects of project management
 Scrum development methodology