IDEF0 charts
IDEF0-models consist of three types of documents: graphic diagrams, text and glossary. These documents are cross-referenced to each other.
A diagram can be associated with structured text, which is a short commentary on the content of the diagram. The text is used to explain and clarify characteristics, flows, intrablock connections, etc. Text should not be used to describe already understandable blocks and arrows in diagrams.
The glossary is intended to identify abbreviations (acronyms), keywords, and phrases used as names and labels in diagrams. The glossary defines concepts and terms that must be equally understood by all participants in the development and users of the model in order to correctly interpret its content.
The graphical diagram is the main component of the IDEF0 model, containing blocks, arrows, connections of blocks and arrows and their associated relations. The blocks represent the main functions of the modeled object. These functions can be broken down (decomposed) into their component parts and presented in the form of more detailed diagrams; the decomposition process continues until the object is described at the level of detail required to achieve the goals of a particular project. The top-level diagram provides the most general or abstract description of the object to be modeled. This diagram is followed by a series of child diagrams that provide a more detailed view of the object.
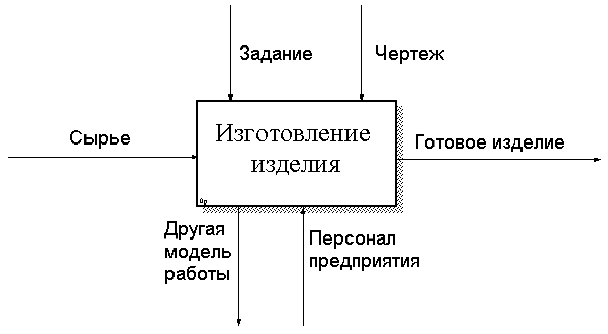
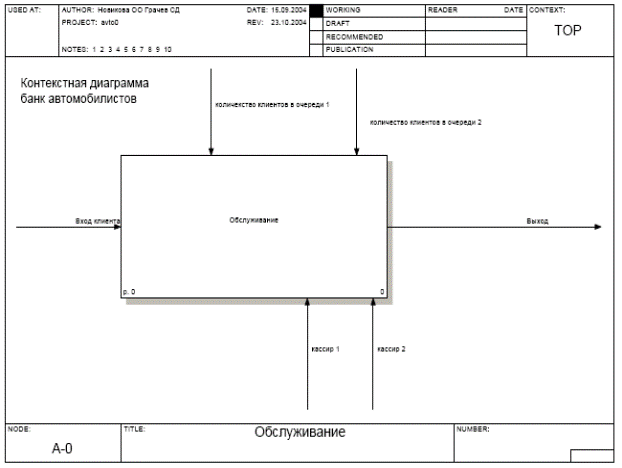
Each model must have a top-level context diagram, in which the modeling object is represented by a single box with boundary arrows. This diagram is called A – 0 (A minus zero). The arrows in this diagram represent the relationships of the modeling object with the environment. Since a single block represents the entire object, its name is common to the entire project. The same is true for all arrows in the diagram, since they represent the complete set of external interfaces of the object. The A – 0 diagram sets the modeling area and its boundary. An example of a diagram A – 0 is shown in Fig. 3.10., Fig. 3.11., Fig. 3.12.
Rice. 3.10. Example of a context diagram

Rice. 3.11. Example of a context diagram

Rice. 3.12. Example of a context diagram
The A – 0 context diagram should also contain concise statements that define the point of view of the official or department from whom the model is being built and the purpose for which it is being designed. These statements help guide the development of the model and help frame the process.
The point of view determines what can be seen and in what section within the context of the model. Changing the point of view leads to consideration of other aspects of the object. Aspects that are important from one point of view may not appear in a model developed from another point of view on the same object.
The goal statement expresses the reason for creating the model, i.e. contains a list of questions that the model must answer, which largely determines its structure.
The most important properties of an object are usually found at the top levels of the hierarchy; as the top-level function is decomposed and divided into subfunctions, these properties are refined. Each subfunction, in turn, is decomposed into elements of the next level, and this happens until a relevant structure is obtained that allows you to answer the questions formulated in the modeling goal. Each subfunction is modeled as a separate block. Each parent block is described in detail by a child diagram at a lower level. All child charts must be within the top-level context chart area.
 Discounted payback period
 Methodological aspects of project management
 Scrum development methodology